


Climate risk used to be an investor-relations exercise. Multifamily operators got fluent in ESG disclosures, GRESB submissions, and metro-scale hazard designations because LPs asked for them, not because they needed the data.
But a metro score can’t tell you whether flood risk sits in one high-rise or spreads across forty assets, and that distinction is what a capital plan needs. Asset-level scoring closes the gap: it geolocates each building and matches it against hazard data specific to that structure, not its ZIP code.
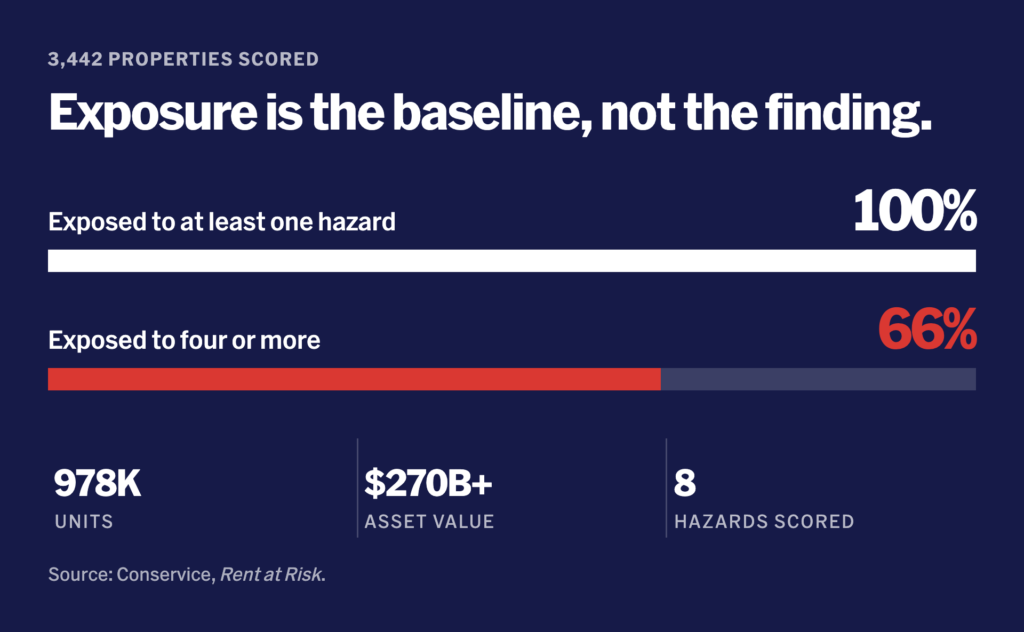
The volume of exposure this uncovers is not, by itself, useful. Conservice’s analysis of more than 3,400 investment-grade multifamily properties found that every asset in the sample carried exposure to at least one of eight standard physical hazards. Two-thirds were exposed to four or more. When exposure is close to universal, exposure counts stop differentiating one asset’s risk from another’s. The more useful question is not whether a hazard is present, but how much financial weight that exposure carries once it’s measured against the asset’s share of portfolio value.
This report explores that reframing. It walks through the relative exposed value framework now emerging across climate vendors and consultants, and the tiered discounting that separates catastrophic hazards from moderate ones. It also addresses the operational distinction between slow-moving stressors and event-driven shocks, and the blind spots, mitigation, cap rate distortion, and infrastructure dependency that no vendor score fully captures. The goal is a concrete sequence operators can use to convert a hazard-by-hazard score into a financially grounded capital plan.
Every asset is exposed to something
Most multifamily operators already have some exposure to climate reporting through GRESB submissions or investor ESG questionnaires, which tend to operate at the portfolio or market level. Asset-level scoring is a different exercise entirely. It geolocates each individual building and matches it against hazard datasets and forward-looking climate projections. This produces a hazard-by-hazard score for that specific structure rather than its ZIP code or metro. This distinction matters operationally because a single asset can score low across most hazards and critically on one, and a portfolio-level average would hide that outlier entirely. A flood-exposed high-rise in a metro that is otherwise low-risk needs a different capital response than a metro-wide flood designation would suggest.
Eight hazards make up the standard physical risk taxonomy most vendors and consultants now use: tropical cyclone, river flood, sea level rise, fire weather stress, drought stress, heat stress, precipitation stress, and cold stress. Conservice’s analysis of 3,442 investment-grade multifamily properties, representing roughly 978,000 units and over $270 billion in estimated asset value, found that 100% of properties in the sample were exposed to at least one of these hazards. Another 66% were exposed to four or more. Heat stress and precipitation stress were nearly universal, present in 99% and 95% of properties, respectively.
Those two figures alone illustrate why raw exposure counts are not a useful decision-making tool. If nearly every asset in a portfolio is exposed to heat stress, then heat stress exposure cannot be the variable that differentiates one asset’s risk profile from another’s. Operators in the Insights by Blueprint Advisory Council have generally converged on the view that the more useful question is not whether an asset is exposed to a hazard, but how much financial weight that exposure carries relative to the rest of the portfolio.
Not all climate risk exposure is created equal
The core framework that has emerged from the vendor and consulting community, and the one most directly transferable to an operator’s own portfolio, is what Conservice terms relative exposed value. This is the difference between an asset’s share of total portfolio hazard exposure and its share of total portfolio value. An asset representing 12% of portfolio value but 21% of exposed risk is overweighted and merits investigation. An asset representing an equivalent share of value and exposure is proportionate and can generally wait.
Building this view requires three inputs. The first is a value proxy for each asset, which can be approximated using unit count multiplied by average net operating income per unit, divided by a market cap rate, when a full appraisal history is unavailable. The second is a binary or tiered exposure indicator per hazard per asset, typically sourced from a climate analytics vendor. The third, and the piece operators most often skip, is a financial weighting that accounts for the fact that not all hazards carry equal consequence.
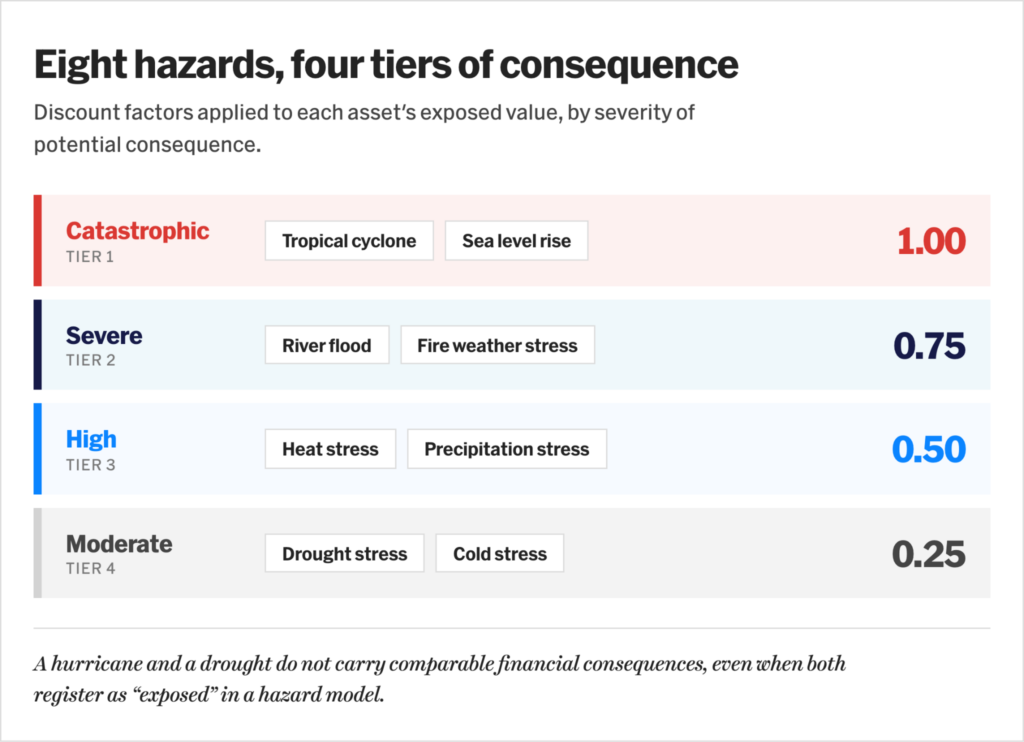
Conservice’s methodology sorts the eight hazards into four tiers based on severity of potential consequence: catastrophic (tropical cyclone, sea level rise), severe (river flood, fire weather stress), high (heat stress, precipitation stress), and moderate (drought stress, cold stress). They apply discount factors of 1.0, 0.75, 0.50, and 0.25 respectively to each asset’s exposed value. This weighting exists because a hurricane and a drought do not carry comparable financial consequences, even when both register as “exposed” in a hazard model. Treating them identically in a portfolio view distorts where the real capital risk sits.
Once each asset’s exposed value is discounted by hazard tier, operators can plot assets or sub-portfolios on two axes: relative risk factor (concentration of exposure relative to value) on one axis and total exposed value on the other, with circle size representing asset value. Assets appearing in the upper-right quadrant, large in value and high in concentration, are the ones that warrant a Property Resilience Assessment or engineering review before any others. In Conservice’s fund-level case study, this method isolated six properties out of eighteen for priority review, representing the bulk of a fund’s $2.5 billion in exposed value.
For operators who want a market-specific reference point rather than a relative portfolio comparison, exposed value per unit offers an alternative lens. Conservice’s data show exposed value per unit for the Portland, Oregon, metro at roughly $581,000, driven primarily by fire weather, precipitation stress, and heat stress, compared with an average asset value of $277,000 per unit across the full national sample. Operators acquiring or holding assets in a specific metro can use this figure to benchmark a target market’s baseline hazard cost structure independent of portfolio-level comparisons.
Stressors versus shocks
A second dimension operators should apply to any hazard-by-hazard score is the distinction between operational stressors and event-driven hazards. The two require fundamentally different capital and operational responses.
Heat, heavy precipitation, drought, and extreme cold behave as ongoing operational stressors. They raise utility costs, accelerate HVAC and plumbing wear, and increase landscaping and water costs gradually over time, rather than through a single catastrophic event. Flooding, tropical storms and hurricanes, wildfire conditions, and sea level rise behave as event-driven hazards, producing infrequent but potentially severe losses that are the primary concern of insurers and disaster-response planning.
This distinction matters for how operators prioritize capital. A portfolio heavily weighted toward operational stressors is a candidate for efficiency capex, HVAC upgrades, insulation, drainage improvements, that pays back through reduced operating expense over a normal hold period. A portfolio weighted toward event-driven hazards is a candidate for insurance strategy review, elevation or hardening capex, and potentially disposition, since the consequence of inaction is a discrete loss event rather than a slow margin erosion.
What a climate risk score cannot see
Vendor disagreement is real and should be treated as a feature of the category, not a defect to wait out. Rather than selecting a single vendor and treating its output as authoritative, operators in the Advisory Council have had more success running acquisition targets and high-concentration holdings through at least two independent models. Then, they flag disagreement itself as a signal for deeper Stage 2 investigation, since disagreement often indicates a genuinely borderline asset rather than model error.
Value proxies introduce their own distortion. Because relative exposed value depends on an accurate estimate of asset value, markets with compressed cap rates will mechanically show higher exposed value even holding hazard exposure constant. A lower cap rate produces a higher implied valuation for the same NOI. Operators comparing exposure across a geographically diverse portfolio need to be conscious that a Washington, D.C., asset and a Mobile, Alabama, asset with identical hazard exposure will show materially different exposed value purely as a function of local cap rates. That difference is not itself a signal of differential physical risk.
Exposure scores do not capture mitigation already in place. A binary exposed-or-not-exposed indicator says nothing about whether a property already has flood defenses, fire-resistant materials, or elevated mechanical systems that meaningfully reduce its practical risk relative to an unmitigated asset with the same hazard designation. Operators who have invested in resilience measures need a parallel internal tracking mechanism, since no third-party vendor score will automatically reflect that investment.
Community and infrastructure risk also sits outside the property line. An asset with no direct flood exposure is still financially vulnerable if surrounding roads, utilities, or municipal infrastructure fail during a regional event, and current asset-level scoring generally does not account for this interdependency.
Turning scores into decisions
Moving from a relative exposed value framework to an operational capital plan requires a small set of concrete steps, each building on the last. The following sequence gives operators a starting structure for translating hazard-by-hazard scores into a prioritized, financially grounded view of where to act first.
Establish a value proxy methodology before requesting hazard data. Operators should settle on a consistent approach, whether NOI per unit divided by market cap rate or a full appraisal-based figure. Apply it uniformly across the portfolio before layering hazard exposure on top, so that value comparisons across markets are internally consistent.
Source hazard exposure data from at least one vendor and treat tier weighting as a portfolio-specific input rather than a fixed standard. Operators should adopt or adapt a hazard-tier discount structure similar to Conservice’s four-tier model. But recalibrate the weighting based on the operator’s own building archetypes, since a garden-style asset and a high-rise carry different practical consequences from the same hazard designation.
Build the relative exposed value view and identify the upper-right quadrant. Plotting assets by relative risk factor against total exposed value, sized by asset value, surfaces the small subset of properties that warrant a Property Resilience Assessment or engineering review. Rather than spreading limited diligence budget evenly across the full portfolio.
Separate operational stressor exposure from event-driven hazard exposure in the capital plan. Assets driven primarily by heat, precipitation, drought, or cold stress should route toward efficiency and maintenance capex planning. Assets driven by flood, hurricane, wildfire, or sea-level-rise exposure should route toward insurance strategy review and, where exposure is severe and concentrated, disposition analysis.
Revisit the assessment on a defined cycle. Climate risk assessment is a cyclical exercise rather than a one-time screen, since portfolio composition, asset values, and hazard model outputs all shift over time. Operators should set a recurring review cadence, commonly annual, rather than treating an initial assessment as static.
Usable data, not just reportable data
Asset-level climate risk scoring doesn’t replace the portfolio-level ESG reporting operators are already producing. It makes it usable for capital decisions, not just investor disclosure. The relative exposed value framework gives operators a defensible way to answer a question raw hazard data can’t. Not whether an asset is exposed, but whether that exposure is disproportionate enough to warrant action now versus on the normal review cycle.
The framework’s value depends on treating its own limitations as inputs rather than afterthoughts. Vendor disagreement, cap rate distortion, and unmodeled mitigation and infrastructure risk don’t undermine the approach. They define where human judgment still has to sit on top of it. Operators who build that judgment into a recurring, defined process will get more out of asset-level scoring than those waiting for a single vendor model to resolve every edge case on its own.
– Nick Pipitone