


Multifamily has measured resident economics one lease at a time: net effective rent, maybe a renewal rate if the PMS made it easy. That worked when rent growth carried NOI. It doesn’t anymore. Yardi Matrix forecasts national rent growth of just 1.4% in 2026, down from 2.6% in 2024, with several Sun Belt metros already declining.
What’s replacing it: value shifts from what a unit rents for to what a resident is worth over the life of the relationship. Resident lifetime value, or RLV, borrows its logic from subscription businesses and senior living operators, who’ve long segmented value by care level and stay length. Applied to multifamily, it pulls revenue, tenure, and cost into one per-resident figure that can inform pricing, renewals, retention spend, and staffing. A handful of operators have built some version of it; most range from a PMS revenue pull to a fully cost-adjusted figure on a unified data layer.
This report covers why RLV matters now, what a defensible model requires, and where operators get stuck, drawing on Advisory Council input. It lays out a five-step framework for building RLV discipline without a perfect data environment. The stakes are real. A single 500-unit asset moving from average to top-quartile retention can generate close to $1 million in annual NOI improvement, and tens of millions in asset value. For an industry out of easy rent growth to lean on, that’s not a number worth leaving unmeasured.
What our survey tells us about RLV in multifamily today
Advisory Council survey data on resident lifetime value reveals that while multifamily operators are interested in tracking the metric, few are actually doing it. Just 14% of respondents to the Advisory Council survey reported having any RLV model in place. Seventy-one percent said they do not currently calculate RLV but are interested in doing so. The data suggests that RLV remains a concept multifamily operators recognize as valuable but have not yet operationalized, creating a meaningful opportunity for portfolios that move first.
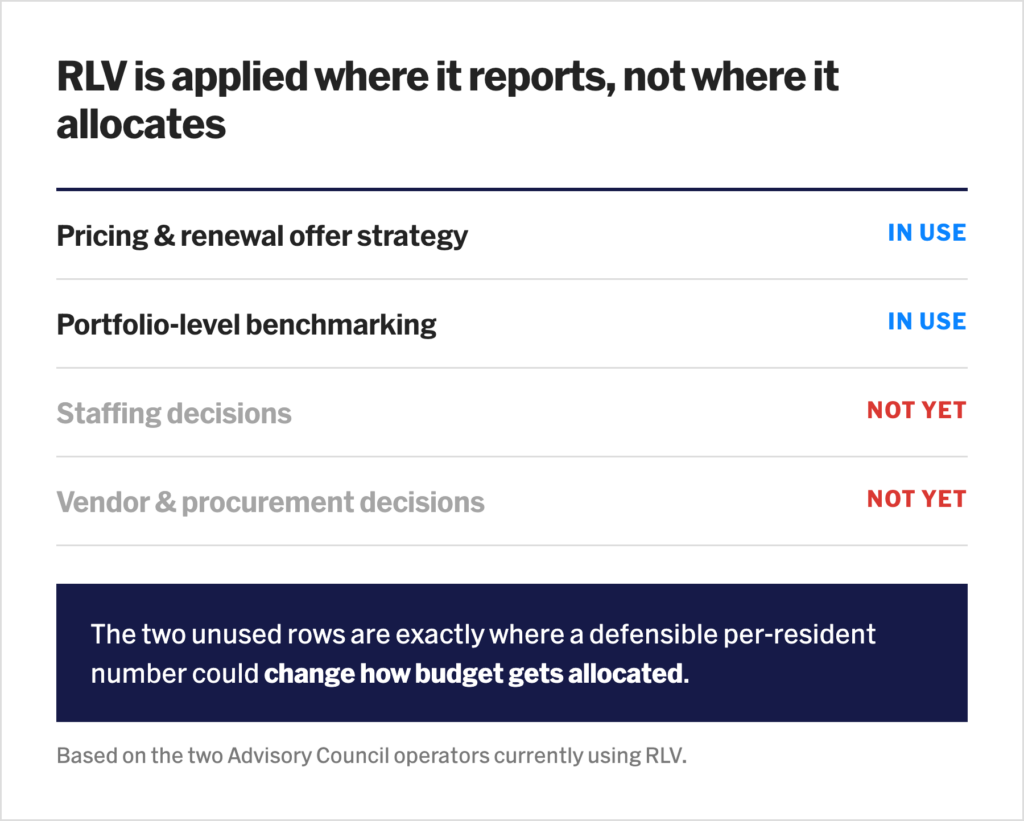
Among the operators with an RLV model in place, the components and applications diverge in instructive ways. Both incorporate net effective rent, ancillary and other income such as parking, pet, and amenity fees, and average tenure or lease renewal rate as core inputs. Both also draw primarily from their property management system as the underlying data source. The informal, ad hoc model, however, extends further, layering in turnover cost, resident acquisition cost, and renewal probability by resident segment, along with a secondary data source from a business intelligence or data warehouse tool. This runs counter to the assumption that process formality correlates with input sophistication. Notably, operators also apply RLV differently in practice. The formal-model respondent uses it to justify resident experience and retention spend and to inform pricing and renewal offer strategy, while the informal-model respondent applies it to portfolio- and asset-level performance benchmarking.
Taken together, the survey data points to RLV as an underdeveloped but high-interest metric category within multifamily operations. The overwhelming share of respondents expressing interest without an existing model, set against a small handful of operators already extracting varied value from even ad hoc approaches, suggests the barrier to adoption is less about the metric’s usefulness and more about the absence of a framework operators can implement. This gap is precisely what this report addresses, laying out a structured approach to RLV that portfolios can adopt regardless of where they currently sit on the maturity curve.
3 forces reshaping resident economics
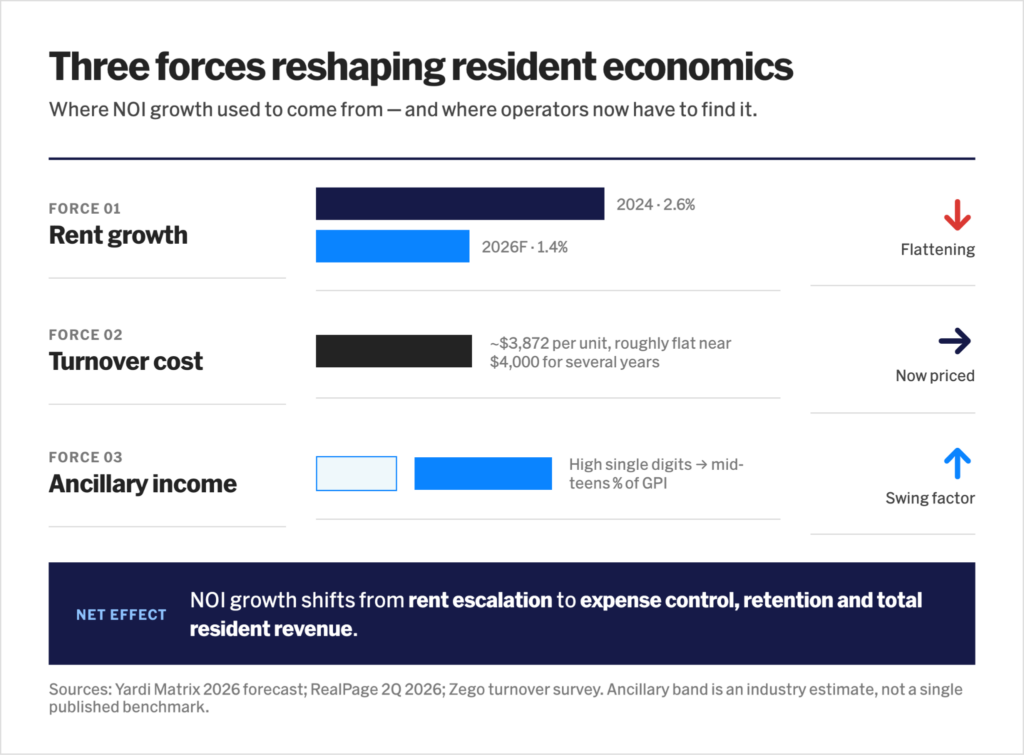
More multifamily operators are interested in Resident Lifetime Value for several reasons. Rent growth has flattened, turnover costs now carry a real (if unevenly sourced) price tag, and ancillary income has quietly become a swing factor in resident economics. Together, these shifts are forcing operators to rethink where NOI growth actually comes from.
Rent growth has flattened further than initial estimates suggested. Yardi Matrix’s latest forecast puts 2026 national multifamily rent growth at just 1.4%, down from 2.6% in 2024. RealPage data shows several Sun Belt metros such as Austin, Denver, Phoenix, and San Antonio posting outright declines. Operators who underwrote acquisitions on 4 to 6 percent annual rent escalations are finding that assumption doesn’t hold. Q2 2026 REIT earnings show blended lease growth running near zero to low single digits, driven almost entirely by renewals rather than new-lease pricing, according to RealPage. This shifts the burden of NOI growth toward expense control and retention.
Turnover costs are increasingly quantified, though the most-cited figures come from different vintages. Zego, which has tracked turnover costs annually since 2021, puts the most recent per-unit figure at $3,872. That number has held roughly steady near $4,000 for several years running. The National Apartment Association’s frequently cited benchmark is that a 225-unit property with 40 percent turnover incurs about $162,000 in annual turnover costs, and that cutting turnover by one unit per month saves over $20,000 a year. This is still widely referenced in industry press, though the underlying calculation dates to 2016 rather than reflecting current-year data. Together, these figures give operators a cost basis to weigh against retention spend, even if the NAA benchmark functions more as a durable industry rule of thumb than a freshly updated statistic.
Ancillary income has become a real margin lever, not a rounding error. Industry estimates commonly put ancillary income in the high-single-digit to mid-teens percent of gross potential income. Urban high-rise properties generally monetize ancillary services more heavily than garden-style assets. Precise bands vary by source and aren’t consistently tied to a single published benchmark survey. That range is wide enough that two otherwise comparable assets can carry meaningfully different resident economics depending on how well the operator monetizes parking, pet fees, package handling, insurance placement, and other services layered on top of rent. Because RLV models are built on total resident revenue rather than rent alone, ancillary performance now moves the number more than it did when it was a marginal add-on.
Together, these three forces explain why per-resident economics have moved from a marketing curiosity into an operating question with real capital implications, even though most portfolios have not yet built the infrastructure to answer it.
A framework for measuring resident value
Advisory Council members who have built an RLV model, even informally, converge on a similar structure. The calculation separates into three tiers of inputs, and an operator’s model maturity can be read directly from how many tiers it incorporates.
Tier 1: Revenue inputs. Net effective rent and ancillary or other income, including parking, pet fees, and amenity fees, form the foundation tier. According to an Advisory Council survey, operators using any version of an RLV model included these inputs and pulled them directly from the property management system. This makes revenue inputs the lowest-friction starting point for any operator building a model from scratch.
Tier 2: Duration inputs. Average tenure or lease renewal rate, and in more advanced models, renewal probability by resident segment, convert a static revenue figure into a forward-looking one. This is the tier that distinguishes a historical value calculation, describing what a resident has already generated, from a predictive one that estimates what a resident is likely to generate over the remaining course of the lease relationship.
Tier 3: Cost inputs. Turnover cost, covering make-ready, vacancy loss, and marketing, along with resident acquisition cost, complete the calculation. Only one of the two Advisory Council operators surveyed incorporated cost-side inputs into an RLV model. The operator using RLV formally for pricing and renewal offer strategy worked from revenue and duration inputs alone. This means that the model computes something closer to gross resident revenue than true net lifetime value. It is a useful anchor, but a different number than what would inform a cost-versus-value comparison on retention spend.
The stack matters because each tier changes what the number can be used for. Revenue-only models describe what a resident has generated. Adding duration inputs allows an operator to forecast rather than simply measure. Adding cost inputs turns RLV into a genuine profitability metric that can be compared against acquisition and retention spend on an apples-to-apples basis.
Senior living operators, who have applied this calculation longer than the broader multifamily industry, offer a useful precedent for segmentation. A senior living operator does not calculate one RLV figure for an entire portfolio. They build the figure by level of care because tenure varies enormously by product. A memory care resident might average 24 months of tenure against $7,000 in monthly rent, producing a lifetime value near $168,000. An independent living resident might average seven years of tenure at a different rate entirely. Senior living operators further adjust the figure by referral source, since leads from third-party lead aggregators tend to convert to shorter stays and carry a commission cost that reduces the effective number. Multifamily operators can borrow this segmentation logic directly. An RLV figure calculated at the portfolio level obscures more than it reveals once asset class, unit type, and lease source are blended together.
Why RLV models are harder to build than they look
Building a defensible resident lifetime value model is harder than the concept suggests. Portfolio heterogeneity, fragmented data systems, weak attribution, and narrow application all threaten to turn RLV into a reporting artifact rather than a genuine decision-making tool.
Portfolio heterogeneity flattens a number that should be segmented. Applying a single RLV figure across a mixed portfolio spanning Class A high-rise, Class B garden-style, student, and senior housing produces a blended average that misrepresents nearly every individual asset. The senior living practice of calculating separate figures by level of care is the model operators should replicate by asset class and unit type, rather than defaulting to one portfolio-wide number for board reporting.
The inputs live in systems that do not talk to each other. Revenue and tenure data sit in the property management system. Ancillary revenue often lives in a separate billing or utility platform. Turnover and acquisition cost data may live in a facilities or accounting system entirely disconnected from the others. Of the two Advisory Council operators with any RLV model, only one unified these sources behind a business intelligence layer. The other pulled everything directly from the property management system, which works for revenue and tenure but rarely captures true turnover or acquisition cost.
Attribution is harder than retention-tool marketing implies. Vendors across the resident engagement and retention category report renewal-rate lifts tied to their platforms. But isolating the effect of a single perks program, communication tool, or AI leasing assistant from broader rent flattening, market conditions, or a concurrent renovation is difficult with the data most operators have on hand. A renewal lift documented after a new tool launch is suggestive, not proof of causation, unless the operator has controlled for the other variables moving at the same time.
RLV can become a justification exercise rather than a decision tool. Of the two Advisory Council operators using RLV, one applies it to pricing and renewal offer strategy and the other to portfolio-level benchmarking. Neither applies it to staffing decisions or vendor and procurement decisions, which are the areas where a defensible per-resident number could most directly change how budget gets allocated. Without deliberately extending the model into those decisions, RLV risks becoming a slide in a deck rather than an input into how budgets get built.
Building an RLV discipline: 5 steps
Building a defensible RLV model doesn’t require solving every data problem at once. A five-step sequence lets operators build credibility and sophistication incrementally, rather than waiting for a perfect system before starting.
Baseline Tier 1 inputs directly from the property management system before layering on additional tools. Net effective rent and average tenure or renewal rate are already captured in most systems of record. Pulling a clean baseline here costs nothing and gives every subsequent addition to the model a stable foundation.
Segment the calculation by asset class and unit type before calculating a portfolio average. A single blended RLV figure obscures the real differences between a garden-style value-add asset and a Class A urban high-rise. Segmentation should mirror the way senior living operators split RLV by level of care, producing a set of figures rather than one headline number.
Add cost-side inputs deliberately, starting with turnover cost. Figures documented by the National Apartment Association and turnover-cost tracking firms give operators a reasonable starting benchmark, generally in the range of $3,000 to $4,000 per unit, that can be refined with property-specific make-ready and vacancy-loss data over one or two turnover cycles.
Centralize the data behind a business intelligence layer rather than leaving it split across the PMS, billing platform, and resident engagement tool. This step separates the Advisory Council respondent using RLV for portfolio benchmarking from the one still working entirely inside the property management system. It is also a prerequisite for adding renewal-probability segmentation later.
Extend RLV beyond pricing into procurement and staffing decisions. Neither Advisory Council respondent currently uses RLV to evaluate vendor contracts or staffing levels, which represents open territory. A per-resident value figure can support decisions about how much a retention platform, resident engagement tool, or additional on-site staff member should reasonably cost relative to the value of the residents that decision affects.
The financial stakes attached to getting this right are not abstract. Modeling a 500-unit Class B asset at $1,600 average monthly rent moving from average to top-quartile retention performance produces an estimated $990,800 annual NOI improvement. At a 5 percent cap rate, this translates into roughly $20 million of asset value creation. Separately, vendor-calculated ROI examples in the retention-technology space illustrate the scale of the opportunity. Paylode, a resident-perks platform, models a scenario in which every $1 spent on a retention program returns $9 in avoided turnover cost. That ratio comes from a single vendor’s own worked example rather than an independently validated industry benchmark, and vendor math in this category tends to favor the product being sold. But even a fraction of that return, applied at portfolio scale, is enough reason for RLV to sit in front of the CFO and COO, not only the marketing team.
The case for starting now, imperfectly
The data behind RLV will never be perfectly clean, and no operator should wait for it to be. Every force pushing this metric to the forefront is structural rather than cyclical, which means the operators who build this discipline now will have a genuine advantage when the next downturn tests retention strategy instead of scrambling to build the model under pressure.
The path forward doesn’t require a perfect system on day one. It requires starting with the inputs already sitting in the property management system, segmenting by asset class instead of defaulting to a portfolio blend, and layering in cost data and centralized reporting as the model matures. The operators furthest along today didn’t start with a unified business intelligence layer. They started with net effective rent and tenure, then built from there. What separates a reporting artifact from a genuine decision-making tool is whether RLV eventually reaches procurement and staffing, not just pricing and renewal offers. That extension is where the real budget impact lives, and it remains largely untapped. The $20 million valuation swing modeled on a single 500-unit asset is a reminder of what’s at stake in getting there.
– Nick Pipitone